
You probably know someone who earns roughly what you earn. Same rough salary bracket, same city, similar lifestyle on the surface. But something feels off when you look closer.
They seem to be doing better financially. Or worse. The numbers should be similar but they are not. And nobody talks about why because money is the one topic most people still treat like a family secret.
Here is the honest answer: income is almost never the deciding variable in how someone’s financial life turns out. Two people can earn identical salaries for a decade and end up in completely different financial positions, not because one got lucky and not because one is smarter, but because of a series of small decisions made consistently over time that compound in opposite directions.
This article shows you exactly what those decisions are, what the math looks like when you run it out over 10 years, and which side of that gap you are currently on.
Meet Alex and Jordan
Both 28 years old. Both living in the same city. Both earning $62,000 per year after tax, which works out to roughly $5,167 per month hitting their bank accounts.
Same income. Same starting point. Same 10 years ahead of them.
By 38, Alex has a net worth of approximately $187,000.
By 38, Jordan has a net worth of approximately $14,000 and is carrying $23,000 in consumer debt.
Same salary. Same decade. A $196,000 gap.
None of what follows involves one of them getting a windfall, inheriting money, or making genius investment decisions. It involves the specific decisions each of them made about ordinary money in ordinary months, repeated over 10 years.
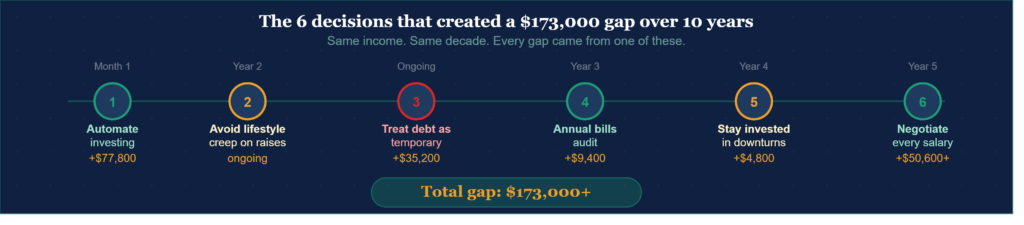
Decision 1: What They Did With the First $500 of Each Paycheque
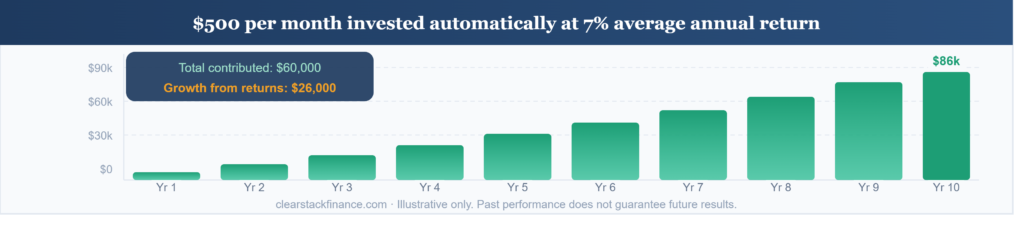
Alex set up an automatic transfer the day after discovering the TFSA in Canada, or the Roth IRA in the US, or the Stocks and Shares ISA in the UK depending on where you are reading this. $500 moved out of the chequing account and into a TFSA invested in a low-cost global index fund, every single month, automatically, before Alex had a chance to spend it.
Jordan intended to invest. The plan was always to put money aside once the month settled down. But the month never really settled down. There was always something. A weekend away. A dinner that ran expensive. A piece of furniture. The $500 stayed in the chequing account and slowly disappeared into the texture of daily life.
After 10 years at a 7% average annual return, Alex’s $500 per month has become approximately $86,000. Jordan has not invested anything consistently and has a savings account with about $3,200 in it.
The mechanism here is not discipline in the motivational sense. It is automation. Alex did not resist temptation every month. Alex eliminated the decision entirely by making the transfer automatic. Jordan faced the same choice 120 times over 10 years and lost it most months because the money was still visible and accessible.
This single decision accounts for more of the gap between them than any other factor.
Decision 2: How They Handled Lifestyle as Income Grew
Neither Alex nor Jordan stayed at $62,000 for 10 years. Both got raises. Both changed jobs once or twice. By year 5, both were earning closer to $74,000 after tax.
When Alex got the first significant raise at year 2, a $4,000 annual increase, the automatic investment contribution went up by $150 per month. The rest went into daily life. The lifestyle improved modestly. But the core savings rate stayed proportional to income.
When Jordan got the same raise, the full amount absorbed into lifestyle within about three months. A nicer apartment. A car upgrade. More frequent dinners out. It did not feel like a splurge because none of it was dramatic. It just felt like keeping up with where life was heading.
Economists call this lifestyle inflation or lifestyle creep. It is not a moral failure. It is the entirely natural human response to having more money available. The problem is that it is invisible while it is happening. Nobody notices that their spending has risen to match their income until they look back and wonder where the raises went.
Alex kept the savings rate roughly proportional to income. Jordan’s savings rate stayed flat in dollar terms and shrank as a percentage of income every time income grew.
By year 10, Alex is saving and investing roughly 18% of take-home pay. Jordan is saving about 3%.
Decision 3: How They Used Debt
Both Alex and Jordan used credit cards. Both carried a balance at some point. But how they related to that balance was fundamentally different.
Alex treated credit card debt as a temporary state with a specific end date. When a balance appeared, it got a payoff plan attached to it immediately. The highest-interest balance got extra payments. The balance rarely stayed above $1,500 for more than two or three months.
Jordan treated credit card debt as a normal part of financial life. Not irresponsible exactly, just present. The minimum payment got made. The balance moved around between cards occasionally when a balance transfer offer came up. But it never really went away. It became a permanent fixture of monthly cash flow, somewhere between $4,000 and $9,000 at any given point over the decade.
At an average interest rate of 19.99%, a $6,500 average balance costs approximately $1,300 per year in interest. Over 10 years that is $13,000 paid to credit card companies for the privilege of carrying a balance. That $13,000 is gone. It cannot be invested. It cannot be saved. It is the price of the balance being normal rather than temporary.
Alex paid interest too but in short bursts that totalled perhaps $800 over the decade.
The difference in interest paid alone is over $12,000. Add the opportunity cost of what that $13,000 could have become if invested and the real cost of Jordan’s permanent balance is closer to $22,000 over the same period.
Decision 4: The One Conversation Alex Had That Jordan Never Did
In year 3, Alex called the car insurance company and asked what the retention rate was, having received a lower quote from a competitor. The call took 11 minutes. The result was a $47 per month reduction in premiums.
That same month Alex called the internet provider and used the same script. $22 per month saved.
Total from two phone calls: $69 per month, $828 per year.
Alex did this type of audit once per year. Not obsessively, just as a habit. By year 10 the cumulative savings from renegotiated bills, cancelled unused subscriptions, and switched providers totalled approximately $9,400 in real money that did not leave the account.
Jordan never made those calls. Not out of laziness but because the individual amounts felt too small to bother with. $47 per month seems trivial when you are thinking about it in isolation. It does not seem trivial when you realize it compounds to nearly $8,000 over a decade when invested.
Small recurring savings are not small. They are permanent and they compound.
Decision 5: What They Did When They Got Uncomfortable
Around year 4, the market dropped sharply. Alex’s investment account, which had grown to about $28,000 at that point, fell to approximately $22,000 over a period of three months. Seeing $6,000 disappear on paper was genuinely unpleasant.
Alex did nothing. Kept the automatic transfer running. Did not look at the account more than once a month. By month eight the account had recovered and was higher than before the drop.
Jordan had started investing a small amount in year 3, about $150 per month into an investment account. When the same market drop happened, Jordan sold everything at the bottom and moved the money back into a savings account earning 2.1% interest. The losses were locked in. When the market recovered, Jordan was not in it.
Jordan did not return to investing for another 14 months. By that point the market had risen 31% from the bottom. The combination of selling low, sitting in cash, and buying back in higher cost approximately $4,800 in real terms compared to simply doing nothing.
Panic selling during a market correction is one of the most expensive things a retail investor can do. It is also one of the most common because the emotional experience of watching your balance fall is genuinely difficult even when you intellectually understand it is temporary.
Alex was not braver than Jordan. Alex just had a slightly longer time horizon and had read enough about how markets work to expect drops rather than being surprised by them.
Decision 6: How They Thought About Their Salary Itself
In year 5, Alex negotiated a salary increase at a job renewal. The number on the table was $71,000. Alex had done research, knew the market rate for the role was $74,000 to $78,000, and asked for $76,500. After a brief back and forth, the offer landed at $74,000.
The $3,000 annual difference from what was originally offered is $30,000 over the following 10 years before raises and compounding. When you factor in that future raises are often calculated as percentages of your current salary, a higher base multiplies forward in a way that makes negotiating feel like one of the highest-return activities available to anyone in employment.
Jordan accepted the first number offered at every job. Not because Jordan was unaware that negotiation was possible but because the discomfort of asking felt worse in the moment than the cost of not asking. That discomfort is real and it is common. But its cost in foregone income over a decade is genuinely significant.
What the 10-Year Gap Actually Looks Like in Numbers
Let’s put the full picture together.
Alex after 10 years:
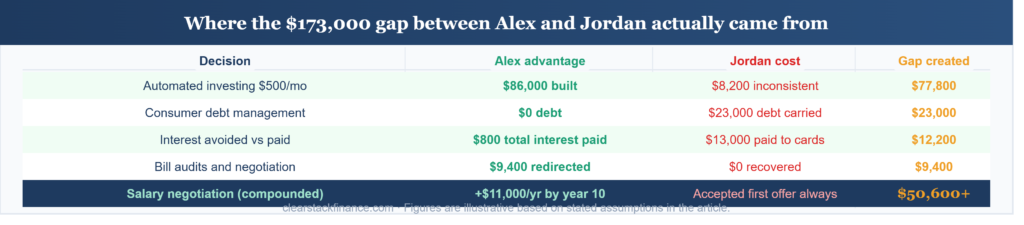
Invested consistently: approximately $86,000 in investment accounts
No consumer debt
Bills renegotiated, subscriptions audited annually: approximately $9,400 in cumulative savings redirected to investments
Negotiated salary increases: earning $11,000 more per year than Jordan by year 10
Total net worth including investments and no debt: approximately $187,000
Jordan after 10 years:
Inconsistent investing: approximately $8,200 in various accounts
Consumer debt of $23,000
Approximately $13,000 paid in credit card interest over the decade
Accepted first salary offered at each role: earning $11,000 less per year than Alex by year 10
Total net worth after debt: approximately $14,000
The gap is $173,000. None of it came from luck. None of it required genius. It came from six decisions, made differently, over 120 months.
Which Side of the Gap Are You On
The honest answer for most people reading this is somewhere in the middle. Not fully Alex, not fully Jordan.
Maybe you invest sometimes but not consistently. Maybe you have never negotiated a salary but you have kept your credit card debt manageable. Maybe you audit your bills occasionally but lifestyle creep has been real.
The point is not to feel bad about the Jordan decisions you have made. The point is that these are the actual levers. Not the stock market. Not a side hustle that blows up. Not crypto. Not getting a promotion at the right time.
The difference between Alex and Jordan is almost entirely in what happened to the ordinary money in ordinary months over an ordinary decade. That is both the most useful and the most uncomfortable thing about this comparison.
Because it means there is no external circumstance to blame and no external circumstance to wait for. The decisions are available to you right now.
Where to Start If You Recognize Yourself in Jordan
Start with the automatic investment transfer. Not next month. This week. Even if it is $100 per month to begin with. The amount matters less than the automation and the starting date.
After that, look at your debt. Not all debt is equal but any consumer debt above 10% interest is expensive enough that paying it down aggressively is mathematically comparable to a guaranteed investment return at that rate.
After that, the bills audit. One afternoon, three months of statements, a list of everything recurring. Cancel what you should cancel and make two phone calls to renegotiate what you can.
None of this requires earning more. All of it requires deciding differently about the money you already have.
Heads up: Alex and Jordan are illustrative examples built from real financial mathematics, not real individuals. All figures assume consistent behavior over 10 years, a 7% average annual investment return, and 19.99% credit card interest on average balances. Actual results will vary based on individual circumstances, market performance, and decisions made. Nothing in this article is financial advice. I am not a financial advisor. Please speak to a qualified professional before making significant financial decisions.
Mike is a data analyst based in Niagara Falls, Ontario. He started ClearStack Finance after spending years figuring out personal finance the hard way. No financial jargon, no boring lectures, just practical money advice for people in their 20s and 30s who are still figuring it out.